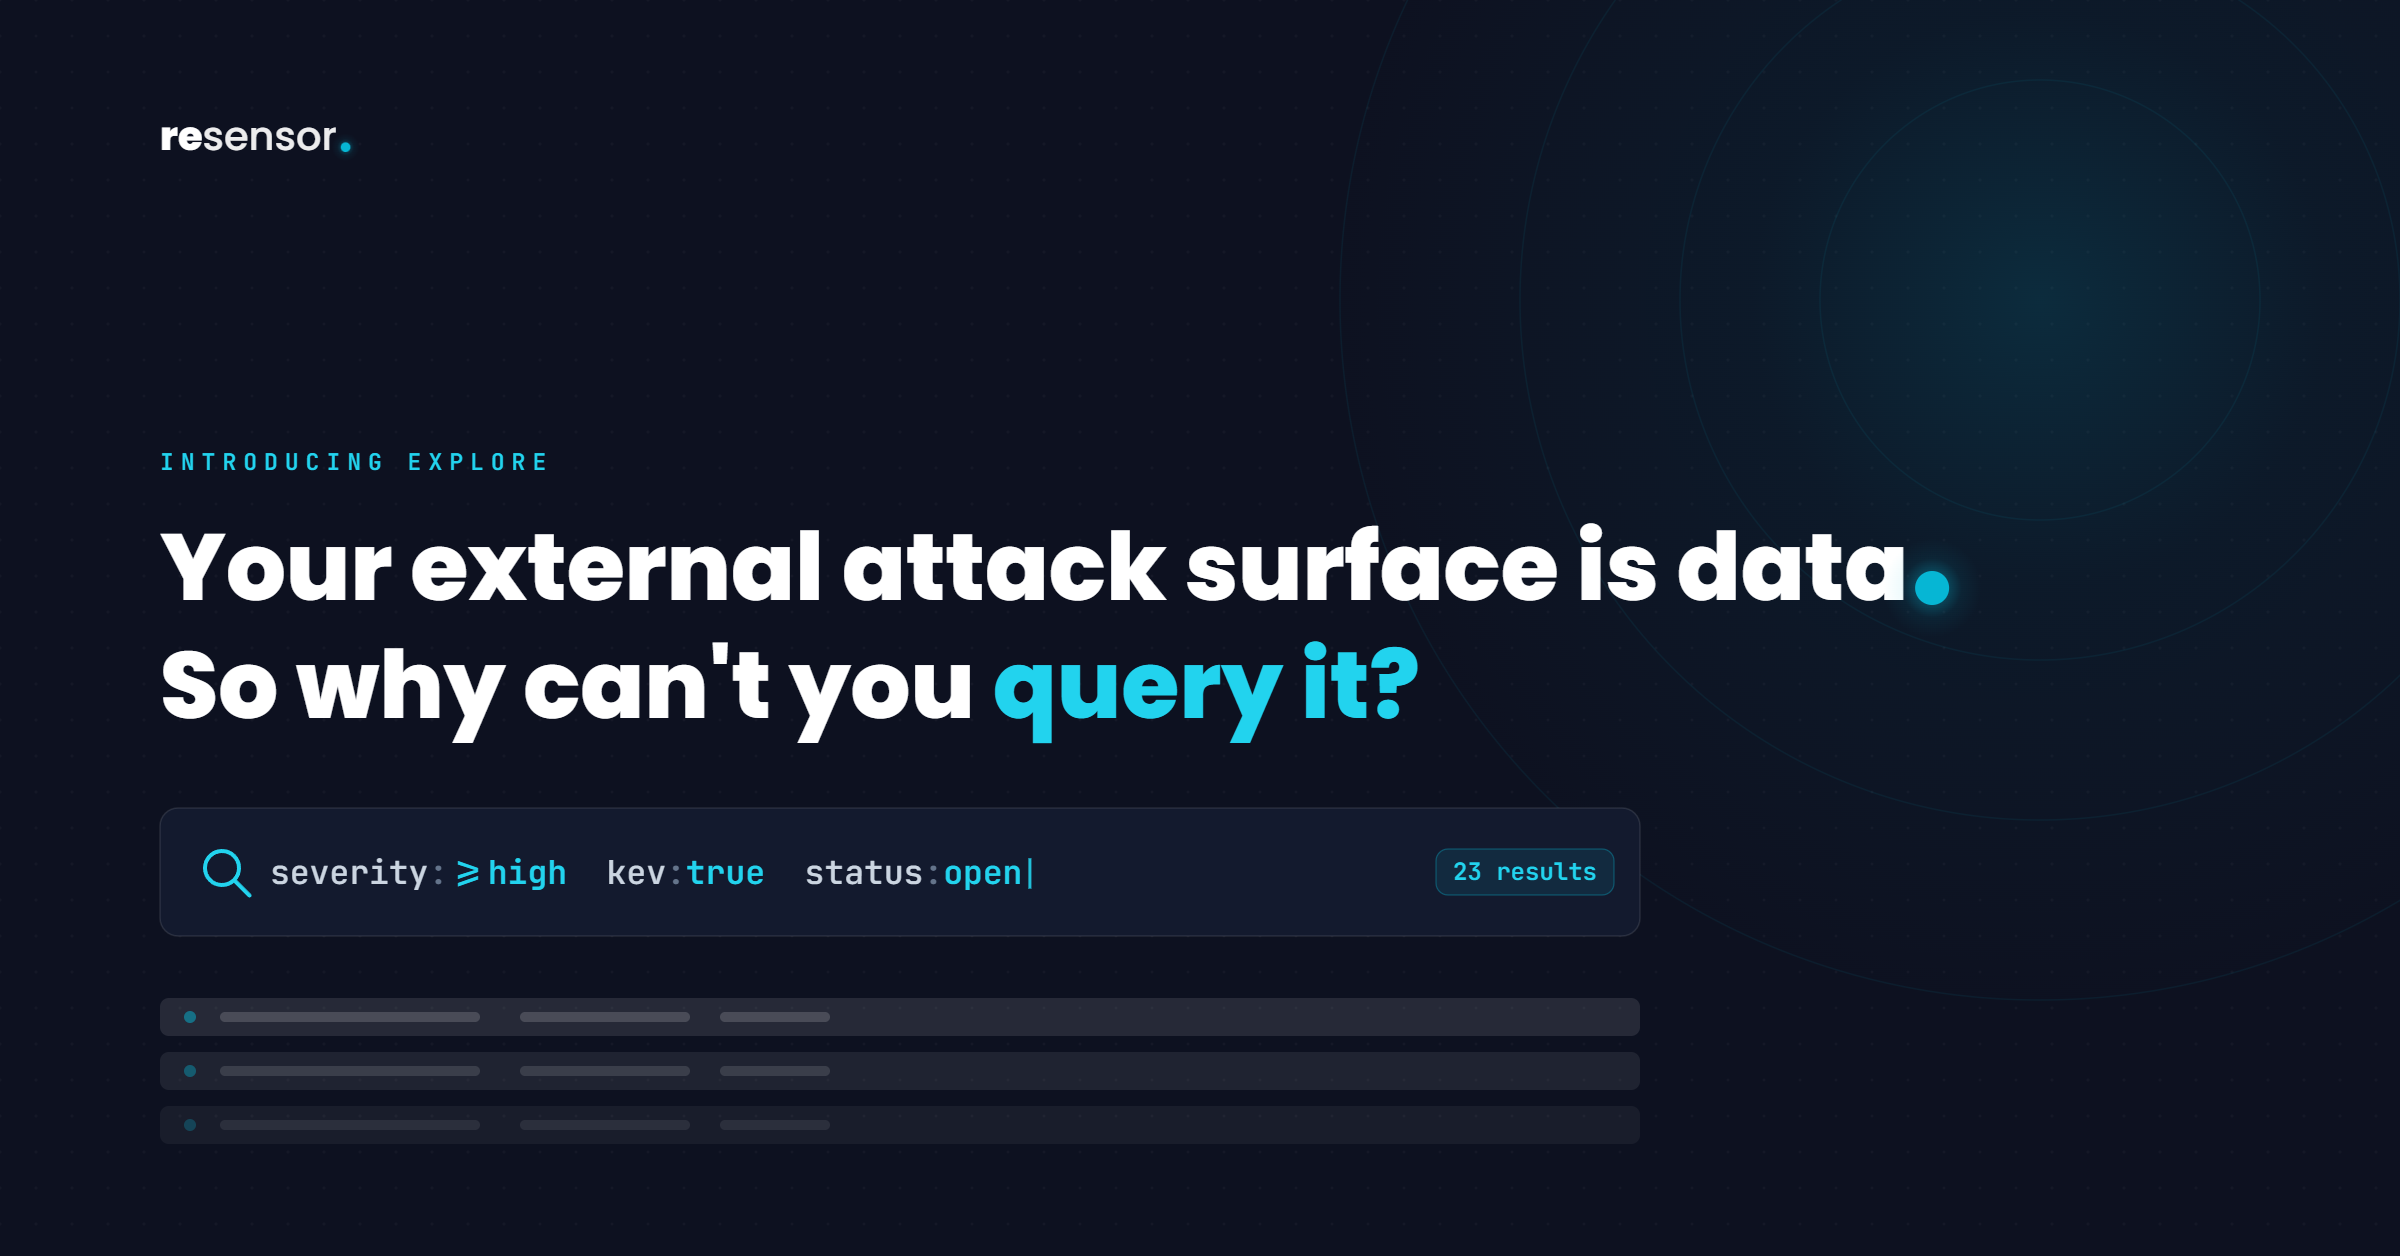
Every external attack surface tool eventually hands you the same thing: a list of findings. Sorted by severity, narrowed by a few canned dropdowns, and an export button for when you need to do anything the dropdowns do not cover. That list is where most tools stop. It is also where the actual work starts.
Security teams do not think in lists. They think in questions. Which of our payment subdomains have an exploitable vulnerability that nobody has triaged yet? How many high-severity email issues have we opened since the last board update? Is our critical count trending up or down this quarter, and on which domain? In a typical product, answering any of those means exporting to a spreadsheet and rebuilding the answer by hand, then doing it all again the next time you want to ask.
The data deserves better than that, because the data already knows the answer. So we built Explore.
A query language for your attack surface
Explore treats your external attack surface as what it really is: structured data. Every finding, every asset, every host, port, and DNS record we discover is queryable through a single readable syntax. You type a question, and the results update as you type.
The grammar is deliberately plain. You write field:value, and you combine clauses the way you already think about them:
The first line is every open, exploitable, high-or-critical finding. The second is every open email-authentication issue. The third is everything on your payment subdomains that nobody has accepted yet. No menus, no rebuilding, no export.
The pieces compose the way you would hope:
- Lists mean "or".
severity:critical,highmatches either.module:web,email,dnsmatches any of the three. - Comparators work on anything ranked or scored.
severity:>=high,epss:>0.5,created:>2026-06-01. - Wildcards walk a domain.
asset:*.acme.comcovers the whole estate under it. - Negation trims the noise.
-status:acceptedorNOT status:accepteddrops what you have already signed off on. - Bare words search everywhere. Type
passwordand it scans across asset, title, and evidence at once.
For findings you can query on severity, module, status, confidence, the affected asset, the finding title, the evidence, KEV status, EPSS score, CVE, and the dates a finding was first created or last seen. Assets have their own schema: kind, value, parent domain, and discovery dates. The fields that have natural shorthands accept them, so domain: works as an alias for scope and sev: for severity. You do not have to memorize a manual to write a useful query on the first try.
And every query lives in the URL. The view you are looking at is a link. You can paste a precise question into a ticket, a Slack thread, or a runbook, and the person who opens it lands on exactly what you saw, back button and all.
See where the risk actually sits
A flat result list tells you what. It is bad at telling you where. So Explore has a second mode that groups instead of lists.
Switch a query to Summary and pick a dimension, and you get the distribution instead of the rows. Group your open findings by module and you see at a glance whether the weight of your exposure is in email, web, DNS, or cloud. Group by domain and you see which property is carrying the risk. Group by exploitability and you separate the findings an attacker can use today from the rest. You can group by severity, module, domain, status, confidence, or KEV, on the same data, without writing anything new.
The grouping is not a dead end either. Click a bucket in the breakdown and Explore folds it back into your query as another clause, then flips you to the matching rows. You start broad, you click into the part that matters, and the query writes itself as you drill. It reads like following a trail rather than composing a database statement.
Turn a question into a dashboard
A good question is rarely a one-time thing. The query you ran to prep for the board meeting is the same one you will want next month, and the month after.
So any query in Explore can become a panel. Pin it to a dashboard as one of four shapes:
- A stat for a single number you want to watch, like open criticals or exploitable findings.
- A breakdown for a live distribution, the same grouped view, kept current.
- A table for the working list of findings behind a query.
- A trend for the shape over time, plotted across your recent scans so you can see a count climbing or falling rather than guessing.
Every workspace starts with a default Attack surface dashboard already built: open findings, critical and high, exploitable, the breakdowns by module and severity, the open-findings trend line, and the working list of what is open right now. It is there the first time you log in, and you can rearrange it, add to it, or build your own alongside it. A dashboard is shared across your team, so the view your analyst tunes is the view your CISO opens.
Turn a question into an alert
The last thing a precise question should have to be is something you remember to re-run.
If a query is worth asking, it is usually worth being told when its answer changes. So any query can become an alert rule. Write the question once, and Explore watches for new findings that match it. severity:>=high kev:true -status:accepted does not just return today's exploitable, high-severity, untriaged findings. As a rule, it tells you the moment a new one appears, and stays quiet about everything you have already seen and handled.
This is the part that closes the loop. Search is how you ask. Dashboards are how you keep an eye on the answer. Alerts are how the answer comes to you when it moves.
One language, everywhere
The thing we are most pleased with is not any single mode. It is that there is only one language underneath all of them.
The syntax you use to search is the syntax you use to filter the assets tab, the syntax you pin to a dashboard panel, and the syntax that backs an alert rule. There is nothing to relearn as you move from looking something up to watching it to being paged about it. You get fluent once, in the search box, and that fluency carries into every other surface of the product. A question you can express is a question you can monitor, chart, and route, with no translation in between.
That is what we mean when we say your attack surface should behave like a database. Not that you should need to be a database person to use it, but that the data should answer the questions you actually have, in the order you actually have them, instead of handing you a list and a CSV button and wishing you luck.
Where this leaves you
A list of findings is an inventory. It is necessary, and on its own it is close to inert. The value is in the questions you put to it, and until now those questions lived in your head and got rebuilt in a spreadsheet every time you needed one answered.
Explore moves them into the product. Ask a precise question and get an answer as you type. See where the risk concentrates instead of scrolling for it. Pin the question to a dashboard your whole team shares. Turn it into an alert so the next answer finds you. One query language across all of it.
Ask your attack surface something specific
Explore is live in every paid workspace. Start a scan, open the search box, and ask it a real question. The answer is probably already in your data.